By Doug Eng EdD PhD, MTPS and Bharathan Sundar
Tennis movement can be characterized by primarily short lateral bursts over typically 3-4 m initiated by a reactive split-step. Movement can be improved by: 1) strength-speed training, 2) technical training, 3) and anticipation training. Kovacs (2009) summarized the importance of lateral movement training. This article will address on-court lateral acceleration with regards to strength-speed and technical training. Lateral acceleration depends on unilateral movement, or specifically, the outside leg to enhance ground reaction force (GRF).
Over and O’donoghue (2008) suggested movement training is often conducted without exact knowledge of physiological, technical and biomechanical demands. Instead, coaches and trainers should consider research and data implications. About 70% of tennis movement is lateral and 20% of tennis movement is forward (Weber et al., 2007). It has been estimated that the average professional on clay courts runs to only 5% of shots where distance > 4.5 m (Ferrauti, & Weber, 2001). Richers (1995) found the average number of continuous steps to the ball was 5.4 on hard courts and 5.7 on clay or grass courts. Steps may vary in stride length depending on rally speed, distance and time. Over the past 25 years, rally speeds have increased which might affect stride lengths and number of steps. SI.com staff (2015) tracked movement of 4 ATP players and found their movement per point was 8 – 14 m which depended on court position, playing style, and length of rally. At the 2017 Australian Open, the average rally lasted 4.47 and 4.85 shots and 5.44 and 5.93 s for the women and men, respectively (Carboch et al., 2018). In addition, selected ATP (N=34) and WTA (N=44) players from September 2019 to September 2020 had mean rally lengths of 4.21 and 4.06 shots with a player average range from 3.2 – 5.4 (Sackmann, n.d.a; Sackmann, n.d.b). Inter-serve and inter-point times were reported at 29-30 s (O’Donoghue, & Liddle, 1998) but more recently it has been reported that actual time from point to point varies about 25-45 s depending on the individual athlete (Bialik, 2014; Sackmann, 2020). From the data, it can be estimated a run over 4.5 m occurs once every 3-3.5 min.
Although runs > 4.5 m occur infrequently, high acceleration and deceleration are more common. Hoppe et al. (2014) found peak running speeds for adolescent players (12-14 y.o) was 4.4 ± 0.8 m/s (9.8 mph). Players exceeded 3 m/s (6.71 mph) once every 5 min or only 18.5 times per match. High acceleration and deceleration was defined as 2.0 m/s2 (or 6.56 ft/s2 ). High acceleration and deceleration was 51.7 and 47.0 times per match, respectively or 0.6/min each. High acceleration was 51.7 per match at 0.6/min or once per 1.7 min, twice as frequent as running distances > 4.5 m as reported for professional players. The typical top speeds for ATP pros is 15-16 kmh and for WTA pros is 13-14 kmh (Game Inside Group, Tennis Australia, 2016). Novak Djokovic reached 36.02 kmh (22.38 mph) in sprinting > 3 m.
Clearly, initial acceleration is more important than top end or maximal speed. In addition, anticipatory cues can optimize movement and reduce acceleration requirements by responding earlier. Nonetheless, technical footwork training should involve training unilateral explosiveness to improve rate of force development (RFD). In the 5 - 10 m interval, an athlete can reach an estimated 70% of top end speed (Duthie, Pyne, Marsh, & Hooper, 2006). Therefore, in tennis, most athletes reach approximately 70% of top end speed. Djokovic’s 36.02 kmh was likely 80-85% of his top end speed, but the distance might have exceeded 10 m.
In short sprints, a combination of vertical and horizontal components of force are applied (Dintiman, G, 2020; Jeffries, 2017). In the initial acceleration 0 - 5 m phase, the horizontal component of speed is of greater importance than vertical component. For maximal top running speed, ground force is the most important determinant (Weyand et al., 2000). The first 3 steps from a standing or still position involves mostly horizontal force (Dintiman, 2020). At maximal linear velocity, a world-class sprinter achieves stride lengths and stride frequencies of 2.6 m and 5 steps/s, respectively (Dintiman, 2020; Mann & Murphy, 2018). Lateral acceleration has lower stride lengths and frequencies. Of interest is the acceleration of top professional tennis players.
LATERAL ACCELERATION OF DJOKOVIC AND NADAL
Novak Djokovic is arguably the best mover on the ATP Tour today. Rafael Nadal is considered one of the best movers of all time. In this case study, 40 groundstrokes were examined (Nadal = 18, Djokovic = 22). High speed 120 and 240 fps HD videography was filmed using a Sony 4K RX10 camera. Velocities and accelerations were estimated over 0.05 s increments from t = 0.00 s to 0.35 s. Measurements were done with displacement of head/shoulders. T=0.00 s starts at the end of the split-step when the head/shoulders begins to move laterally. It was noted that acceleration over each 0.05s interval was not constantly increasing or decreasing, but dependent on the rate of force production (RFD) from either leg.
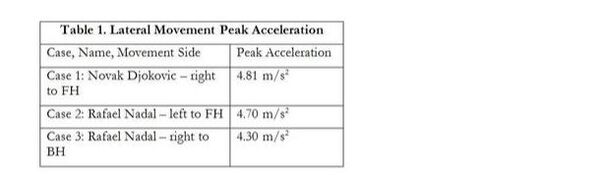
Table 1 shows 3 maximal accelerations calculated from the selected 40 shots. All maximal accelerations occurred on return games where defensive skills include greater movement. Service games which are initially offensive often do not require the same acceleration early in the point. It is assumed these peak accelerations probably represent the top 10% accelerations of both players (given the 3 measurements shown in Table 1 were the highest from 40 groundstrokes). It should be noted that the top 1 or 2% of peak accelerations may exceed these values. Figures 1 show Rafael Nadal shortly after initial acceleration. Comparatively, Usain Bolt in a starting still 4-point stance (i.e., hands and feet on the ground) has been calculated to reach an initial acceleration of 9.5 m/s2 in the 100 m sprint. (Gómez et al., 2013). However, Djokovic and Nadal are sprinting repeatedly and Bolt is sprinting once. In addition, the short distances in tennis and the 100 m sprint do not have the same demands. Curiously, if the acceleration forces were only in the vertical direction, depending on the actual RFD and impulse, the vertical jumps for Djokovic and Nadal would be around 0.20 – 0.25 m whereas by comparison, Bolt would be ca 0.9 m (Gómez et al., 2013).
On wide balls, Djokovic can typically achieve stride lengths of 2 m and stride frequencies of 4 steps/sec. As noted earlier, acceleration over each 0.05 sec increment was not uniform but dependent on unilateral RFD. An athlete may initially push off from either leg unevenly as unilateral (i.e., single sideways) leg force may not be equal strength. In addition, leg drives are in different phases such as the takeoff or touchdown positions. Hence, acceleration measured for Djokovic and Nadal did not involve a steady RFD.
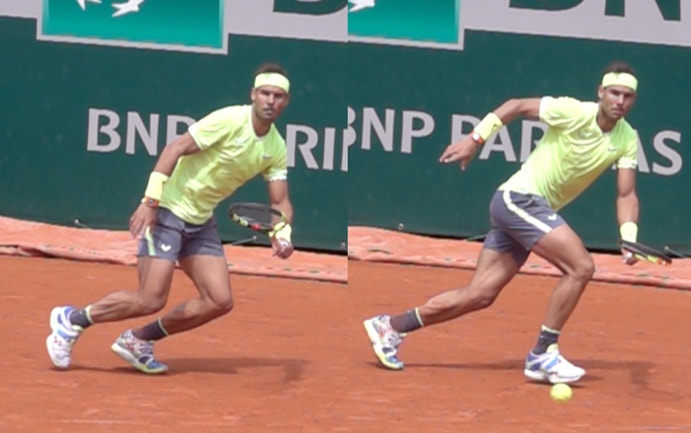
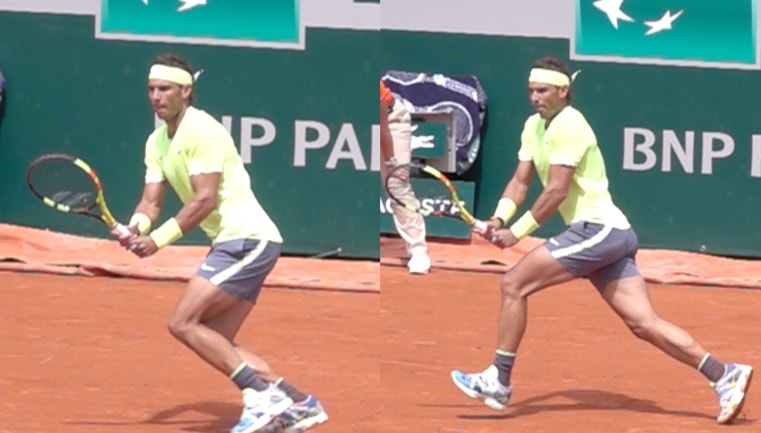
Figure 1A (left). Rafael Nadal 0.217s and 0.379s after initial acceleration in Case 2 moving to the forehand. 1B (right). Rafael Nadal 0.288s and 0.413s after initial acceleration in Case 3 moving to the backhand.
Few studies have been conducted with lateral speed or the development of lateral speed. Court surface such as clay or hard courts can affect concentric and eccentric forces in both the initial acceleration to the ball and deceleration in recovery. Weber et al. (2007) pointed out players will run 0.25 to 0.50 m more to the forehand side than the backhand side. Although cases were limited, we see that for Table 1, the measured acceleration to the forehand was higher than to the backhand (e.g., Nadal was recorded as 4.70 m/s2 and 4.30 m/s2 for the forehand and backhand, respectively). Therefore, acceleration to the forehand may be slightly more important for training. In novice athletes, t-test shows significant differences (p=0.001) between either lateral movement as measured over 4 m (Salonikidis, & Zafeiridis, 2008). For elite athletes, movements to either side were similar. Hewit et al. (2012) discussed unilateral leg movement in linear and lateral jumping and running. Largest leg strength differences were found in lateral movement (single leg countermovement lateral jumps or SLCM-L) but it was suggested that up to 15% difference was normal and acceptable. That is, an athlete might be 15% weaker in one leg than the other and normal athletic movement is not affected. Tennis, however, differs from most sports in requiring greater lateral movement and 180˚ change of directions (COD). Most field sports require cutting at 20-60˚ where asymmetric leg strength may not seriously affect movement.
It is reasonable to assume the same concepts in rate of force production and ground force reaction apply in a lateral direction as with linear speed. In lateral movement, most force is generated by the outside leg which is farther from the intended direction. After the stroke, deceleration for recovery to a favorable court position requires the legs to switch roles where in movement to the right, the left leg is the outside leg in explosive movement towards the ball. When the athlete moves back to the center or to the right, the left leg is the outside leg in change of direction (COD) or recovery phase.
Tennis players could be tested on the outside leg moving either to the forehand or backhand side. Using unilateral strength and plyometric training to train unilateral leg force production may improve athletes with weaker movement to one side. Nevertheless, it is important to train both legs for acceleration since they both assume the force-generating reactive power.
Continued in a few days...