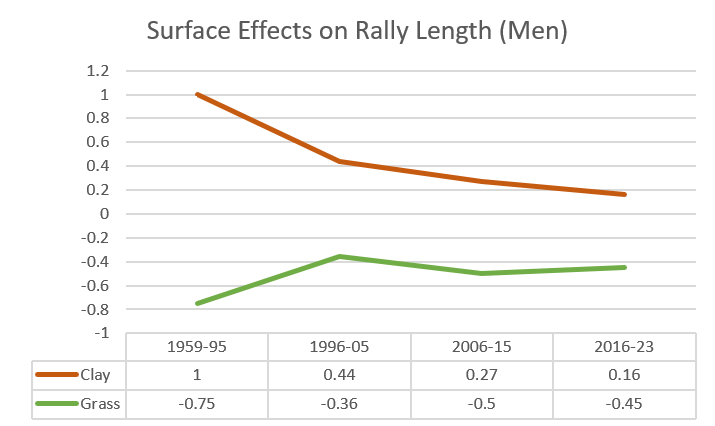
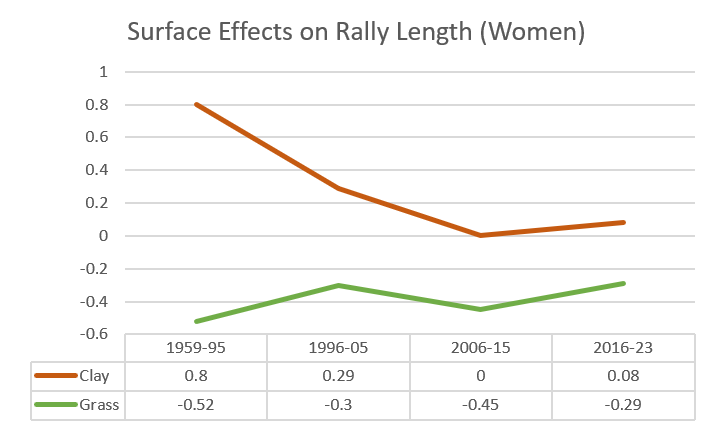
Grass courts before the convergence For more than a decade, players and pundits have complained that surface speeds are converging. To oversimplify their gripes: Everything is turning into clay. Hard courts have gotten slower, even many of the indoor ones. Grass courts, once a bastion of quick-fire attacking tennis, have slowed down as well. I’ve attempted to confirm or refute the notion a couple of times. In 2013, I used break rate and ace rate to see whether hard and clay courts were getting closer to each other. The results said no. Many readers complained that I was using the wrong metrics: rally length is a better indicator. I agree, but rally length wasn’t widely available at the time. In 2016, I looked at rally length for grand slam finals and found some evidence of surface speed convergence. The phenomenon was much clearer in men’s tennis than women’s, a hint that it wasn’t all about the surface , but that tactics had changed and that the mix of players in slam finals skewed the data. Now, the Match Charting Project contains shot-by-shot logs of more than 12,000 matches. We can always dream of more and better data, but we’re well past the point where we can take a more detailed look at how rally length has changed over the years on different surfaces. Forecasting rally length Start with a simple model to forecast rally length for a single match. You don’t need much, just the average rally length for each player, plus the surface. Men who typically play short points have more influence on rally length than those who play long ones. (This is worthy of a blog post of its own–maybe another day.) Call the average rally length of the shorter-point guy X and the average rally length of the longer-point guy Y . Using data from the last seven-plus seasons, you can predict the rally length of a hard court match as follows: X + (0.7 * Y) – 2.6 The numbers change a bit depending on gender and time span, but the general idea is always the same. The short-point player usually has about half-again as much influence on rally length than his or her opponent. For men since 2016, we can get the clay court rally length by adding 0.16 to the result above. For grass courts, subtract 0.45 instead. For example, take a hypothetical matchup between Carlos Alcaraz and Alexander Bublik. In charted matches, Alcaraz’s average rally length is 4.0 and Bublik’s is 3.2. The formula above predicts the following number of shots per point: Hard: 3.39 Clay: 3.55 Grass: 2.94 The error bars on the surface adjustments are fairly wide, for all sorts of reasons. Courts are not identical just because their surfaces are given the same names. Other factors, like balls, influence how a match goes on a given day. Players adapt differently to changing surfaces. The usual dose of randomness adds even more variance to rally-length numbers. Changing coefficients These surface adjustments aren’t very big. A difference of 0.16 shots per point is barely noticeable, unless you’re keeping score. Given the variation within each surface, it means that rallies would be longer on some hard courts than some clay courts, even for the same pair of players. That brings us back to the issue of surface speed convergence. 0.16 shots per point is my best attempt at quantifying the difference between hard courts and clay courts now –or, more precisely, for men between 2016 and the present. If surfaces have indeed converged, we would find a more substantial gap in older data. That’s exactly what we see. I ran the same analysis for three other time periods: 1959-95, 1996-2005, and 2006-2015. The following graph shows the rally-length gap between surfaces for each of the four spans: For example, in the years up to 1995, a pair of players who averaged 4 shots per point on a hard court would be expected to last 5 shots per point (4 + 1) on clay. They’d tally just 3.25 shots per point (4 – 0.75) on grass. By the years around the turn of the century, the gap between hard courts and grass courts had narrowed to its present level. But the difference between hard and clay continued to shrink. The current level of 0.16 additional shots per point is only about one-sixth as much as the equivalent in the 1980s and early 1990s. The graph implies that hard courts are constant over time. That’s just an artifact of how I set up this analysis, and it may not be true. It could be that clay courts have been more consistent, something that my earlier analysis suggested and that many insiders seem to believe. In that case, rather than a downward-sloping clay line and an upward-sloping grass line, the graph would show two upward-sloping lines reflecting longer rallies on non-clay surfaces. Women, too The women’s game has evolved somewhat differently than the men’s has, but the trends are broadly similar. Here is the same graph for women’s rally lengths across surfaces